Transformative public access map unveiled
Herenga ā Nuku Aotearoa, the Outdoor Access Commission, is releasing a major upgrade to its mapping of public access to the outdoors.
After two years of cutting-edge work, an example of the improvement is that we can now confidently identify 55,000 km of publicly accessible unformed legal roads in New Zealand and point to them on our interactive map.
Acting chief executive Phil Culling said the upgrade represents a significant milestone for Herenga ā Nuku, the country’s only mandated mapper of public access.
“This is the most comprehensive and robust digital representation of public access Aotearoa has ever had.”
Involving a vast amount of innovative work improving the quality of the data upon which the public access mapping is based, the upgrade represents a crucial tool for anyone who wants to get outdoors, Phil Culling said.
The new map is now available to the public and will sit in Herenga ā Nuku’s mapping menu beside the old version so that people can experiment, explore, and compare.
Herenga ā Nuku GIS manager Matt Grose, who led the upgrade, said his team will focus on public feedback before turning off the old version at end of the year.
“This latest upgrade is a paradigm shift in structure and reliability. We welcome all input as we continue toward completion,” Matt Grose said.
He attributed much of the upgrade’s successful implementation to the outstanding domain knowledge and technical work of Herenga ā Nuku’s operations team.
A key member of that team is land advisor Catherine Monk.
“So much has changed in the public access data, in terms of the information now provided and the additional clarity. It’s quite interesting seeing how much more is showing up,” she said.
The mapping now includes not just whether an area is publicly accessible, but also the reason why; that is, the evidence for that conclusion, she said.
“I was head down in the books, the legislation. I provided the terminology and guidance in order for GIS to be able to create their rules and the scripts to be able to pull through the information that we wanted. For me the goal was showing as true and correct public access information as we could.”
Catherine Monk is particularly happy with the new “managed by” pop-up information panel, which enables users to contact land managers directly about the nuances of a particular area’s access status.
“I’m looking at that land from a data-based, legislative, digital point of view. But on the ground there’s guidance, signage, instructions, formed tracks that might or might not indicate there is public access. All that is too big to capture in our system. So the ‘managed by’ information is really useful.”
Thousands of new reserves
Another example of the improvements is the adding of thousands of new reserves to the data set.
This has been done, firstly, by securing data supply from a lot more councils than we had previously. While we still need more buy-in from councils around the country, the upgrade represents a significant advancement.
Secondly, we have newly identified a thousand hectares of esplanade reserves because of the data pipeline referencing 14 data sources, as opposed to the one source we used originally.
Thirdly, a thousand hectares of public access easements have been added, through the work our operations team do to manually authorise their inclusion in the public access data.
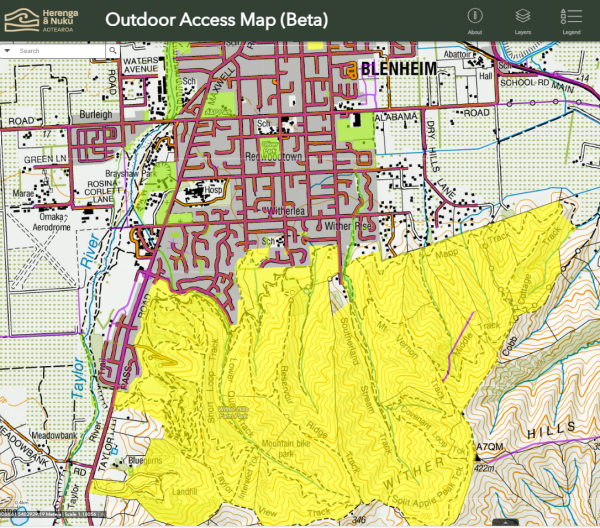
One significant example of previously unseen access was obtained through an agreement from Marlborough District Council to supply data. Because of this we have now included Wither Hills Farm Park in our map of public access areas. Visit map
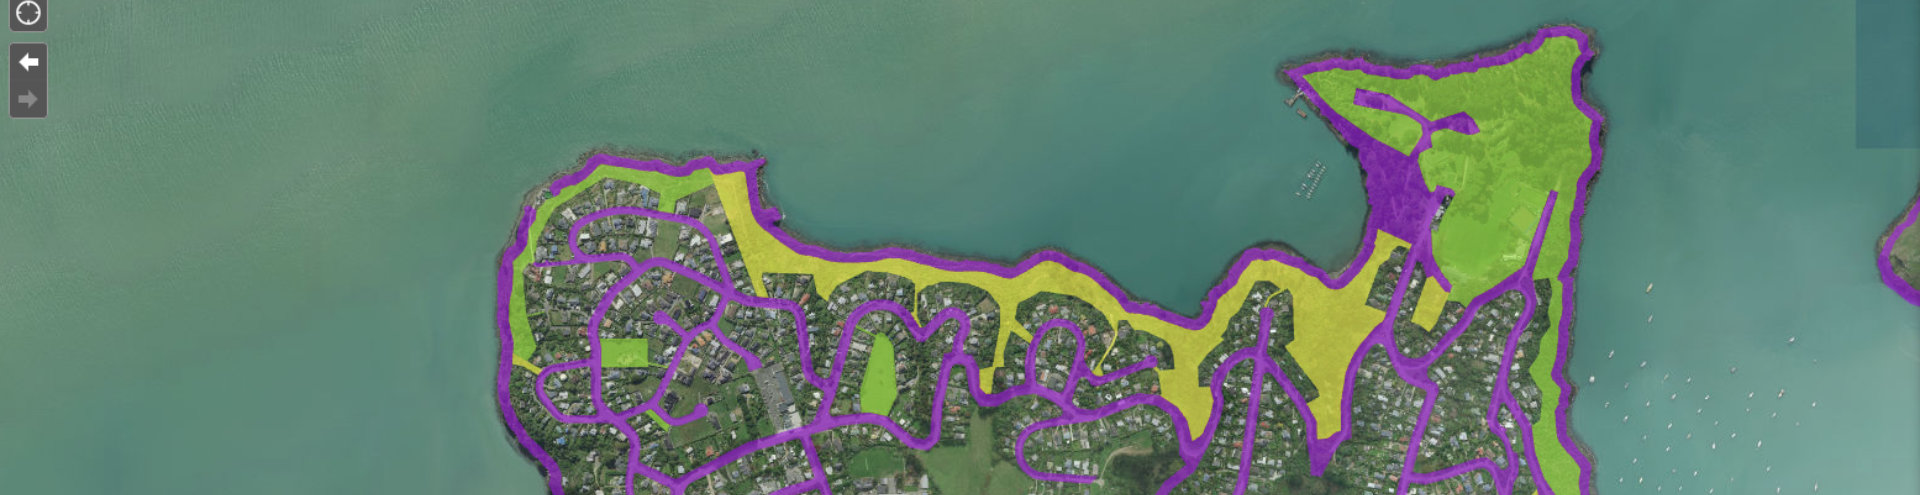
Unformed legal roads
Another exciting aspect of the new map is that it reveals the extent of unformed legal roads—or ‘paper roads.’
Previously, there was no clear difference in the mapping between a formed and unformed road, since their legal status in the cadastre is the same and the data we had didn’t allow for a distinction. Users had to cross-reference the public areas map with another data source, for example, an aerial imagery base map or a photo taken on the ground, to be able to distinguish a formed road from an unformed one. For example, to tell where an unformed road-section carried on over pasture or into bush, after the formed part of the same legal road ended. The upgrading of the data means we can now specify, in the data, which roads are likely to be unformed.
Also for the first time, we can calculate that these roads span 110,370 hectares—approximately 20 meters wide on average—and total 55,185 kilometres in length.
As a comparison, to travel 55,000km, you’d have to walk the length of New Zealand via the 3,000 km Te Araroa Trail no fewer than 18 times.
And in terms of area, if you set foot on every square metre of Tongariro National Park—it’s just under 80,000 ha—you’d still fall well short of the 110,370 ha of Aotearoa comprised of ‘paper roads’.
The total land occupied by all legal roads, both formed and unformed, is 362,926 hectares (181,463 km).
The region with the largest area in roads, formed and unformed, is Otago, with 42,835 ha. It also has the country’s most unformed legal roads, at 16,733 ha.
The region with the smallest area in all roads is Gisborne, at 9,431 ha; while the smallest amount of unformed legal roads belongs to Wellington, at 1,857 ha.
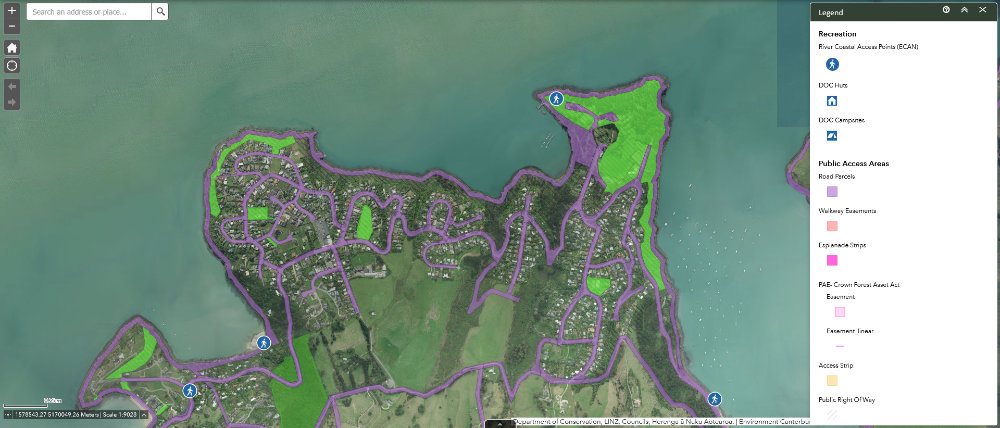
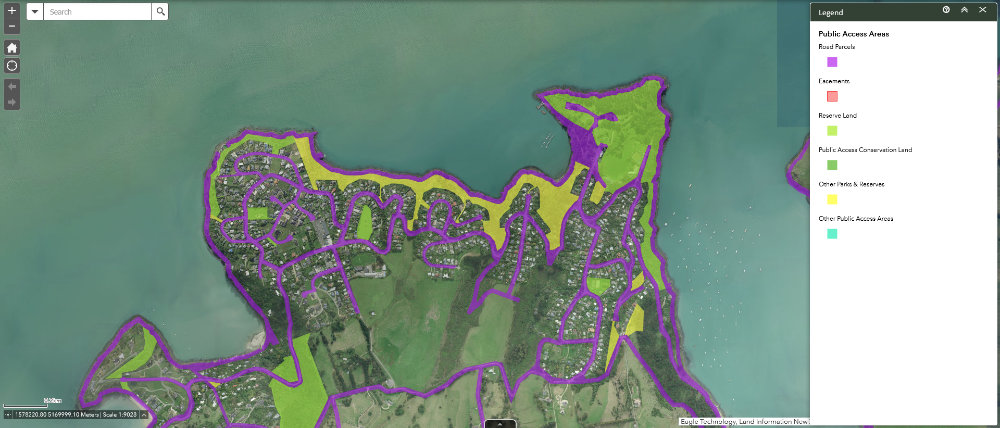
Simpler, yet more specific
We now have six classes of public access, which contain 34 sub-categories called “types”.
These classes and types relate to the legislation that establishes them.
Previously, there were seven categories which we developed over time, in an attempt to describe the complexity and diversity of public access.
This system had many strengths but also frailties, having evolved, out of necessity, in an ad hoc, organic way.
The automated process we developed also encountered obstacles in managing the land information and titling such as spelling mistakes in survey records, variations in the terminology and a lack of clarity in the way legislation was catered for in the digital lodging of survey data.
The new structure has been systematically designed to capture and accurately classify everything it could in a more complete, disciplined and robust way (while still acknowledging the limitations in the source data).
More numbers: North vs South
- Total land area versus public access areas: The North Island has three-quarters (77%) of Aotearoa’s population, 43% of its land area, but less than a quarter (23%) of its publicly accessible outdoor areas.
- Conservation land, unformed legal roads and tangata whenua land: The South Island has 81% of Aotearoa’s publicly accessible conservation land, 61% of its unformed legal roads and only 4% of its tangata whenua land.
Public access mapping: a timeline
The background of this upgrade goes as far back as 2001, when Land Information New Zealand (LINZ) launched Landonline as the country’s authoritative source of cadastral survey and title information. While it was a leap forward, it was not fully digital, and it had no mandate to record or map public access areas.
In 2008, the Walking Access Act established the Walking Access Commission (which later became Herenga ā Nuku Aotearoa, the Outdoor Access Commission). The Act legally required the Commission to compile, hold and publish maps and information about land over which members of the public have walking access.
In 2009 this task became easier when LINZ made digital lodgement of survey and title transactions mandatory. That is, the records of these transactions could no longer be consigned to paper files stored in the back rooms of offices scattered around the country, but instead, they had to be accessible online to anyone, anywhere.
As a result, in 2010, the Walking Access Commission developed and launched the first version of its online mapping system, Walking Access Mapping System (WAMS). On top of LINZ’s survey and title records and a base layer composed of topographic or aerial imagery, the Commission could now add a layer showing public access areas.
Between 2010 and 2018, WAMS underwent various phases of improvement as the nation’s vast swathes of historic and current land information records were gradually digitised, translated, interpreted and otherwise captured by the new technology.
In 2018, it became clear that a more systematic approach was needed to fill gaps arising from the organic way the country’s land information was digitised, the limited public resources available, and the complexities of cross-government interaction.
As a result, also in 2018, George Williamson, a widely experienced surveyor and public access and process improvement advisor, was commissioned to write an independent report on the state of the Commission’s public access data and how to make it more complete.
This prompted the Commission to rebuild its public access areas dataset from scratch.
In 2022, the Commission was renamed Herenga ā Nuku Aotearoa, the Outdoor Access Commission, reflecting that outdoor access also includes cyclists, horse riders and others. From that point, its mapping system, WAMS, kept its name in acronym form, but it no longer refers only to access on foot.
In 2023, to speed up and improve the rebuild of the public access areas dataset, the Commission launched a two-year Data Improvement Programme.
In early 2025, that programme developed a new data pipeline — an automated, repeatable process for identifying public access.
All these developments have now culminated in this latest upgrade: Aotearoa’s most complete mapping of public access areas is now open for the public to explore.